LSESU Essay Evidence Selection: Use a Statistic to Test an Argument
When preparing for the LSESU Economics Society Essay Competition, students often struggle with evidence selection. The prompt asks for a specific argument, but finding a statistic that genuinely supports it—rather than just sounds impressive—is difficult. This article addresses the precise question of how to use a statistic to test your economic argument, ensuring your evidence withstands scrutiny under the competition’s rigorous rubric.
The Role of Statistics in LSESU Essays
The LSESU essay is not a data dump; it is an argumentative piece where evidence serves logic. According to the official scoring criteria, “Evidence and Examples” account for 15 marks, requiring claims supported by empirical studies or credible data. However, a statistic only earns these marks if it directly tests the causal or logical link you propose. Many students cite a number because it relates to the topic, not because it validates their specific claim. For instance, citing total GDP growth does not prove that a specific tax policy caused inequality changes unless you control for other variables. The key is alignment: the statistic must be capable of falsifying your argument if your reasoning is flawed.
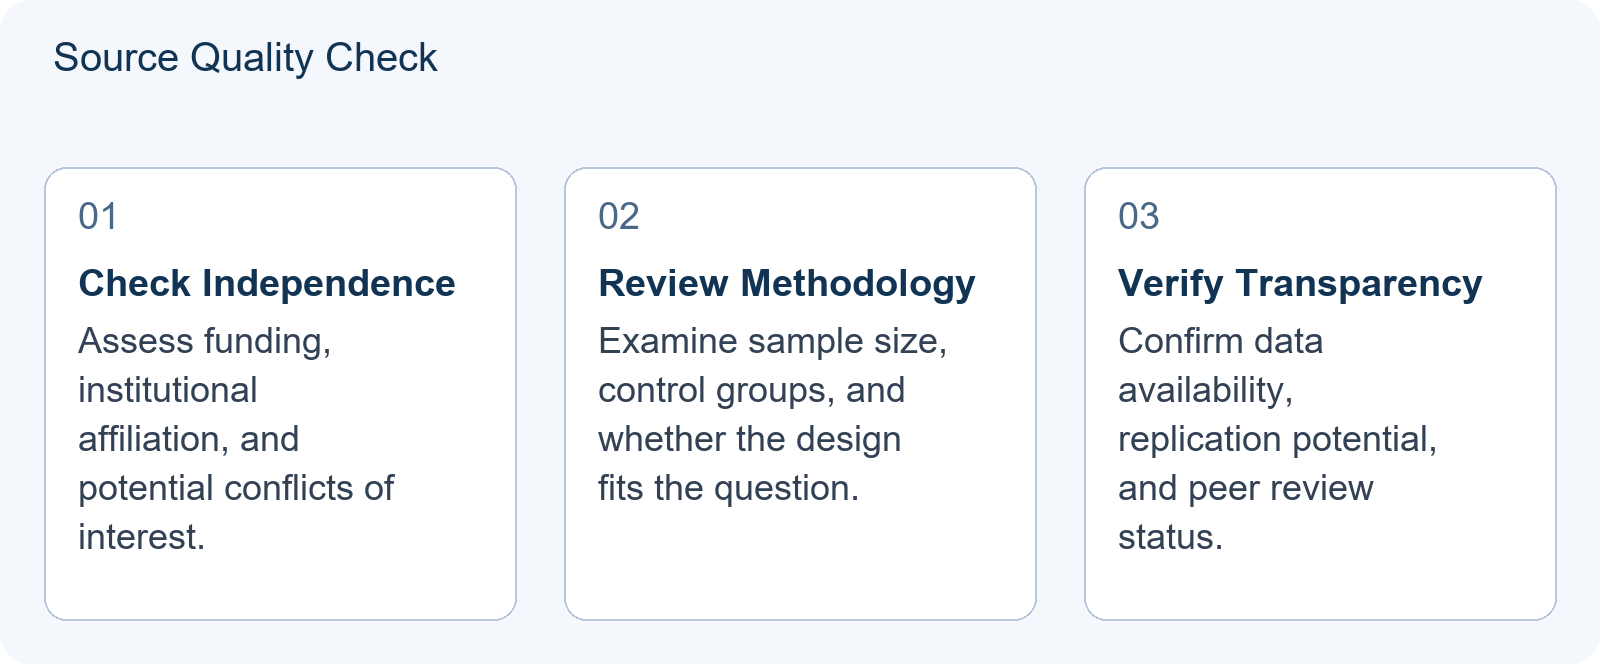
Importantly, peer review alone does not guarantee independence or transparency in research. An institutional survey with transparent methodology may better fit your specific question than an unrelated journal article with opaque funding. Always assess the actual design, data, funding, and outcomes of any source you consider. Journalistic original data can also be legitimate if its methodology is checkable and reproducible.
Teaching Illustration: Testing a Minimum Wage Claim
[Teaching Illustration — not a real study]
Consider a student arguing that raising the minimum wage reduces poverty without causing significant unemployment. They might imagine a scenario where a 10% wage increase coincides with a 1% drop in employment. Is this sufficient to test their claim? Let’s examine why it is not.
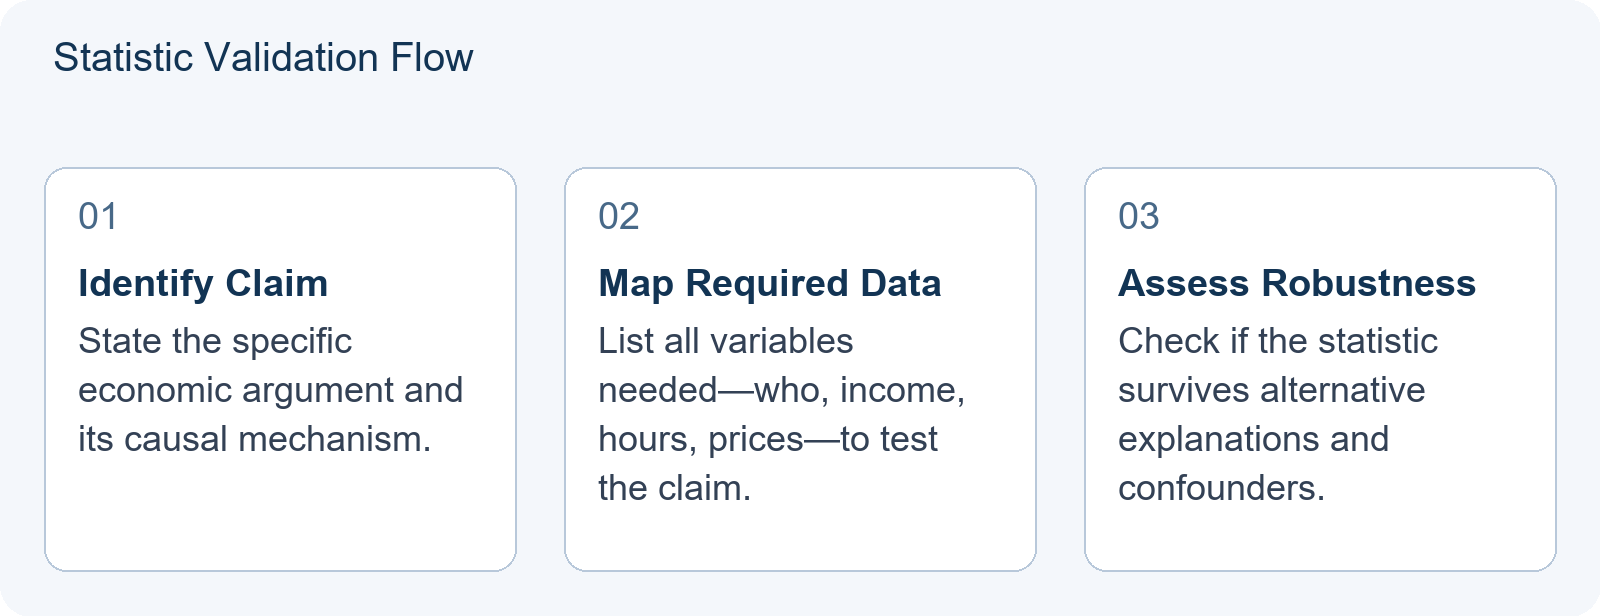
First, employment effects alone cannot establish poverty effects. We need to know who loses employment—whether it is primary earners in poor households, secondary earners, teenagers in non-poor households, or some other group. Second, we need household income data, not just individual wages. A worker whose hours are cut from full-time to part-time may see higher hourly pay but lower total monthly income. Third, we need price data: if the wage increase raises local prices, the real purchasing power gain may be smaller than the nominal figure suggests. Without connecting employment changes to household income, hours worked, and local prices, the statistic does not test the poverty claim at all.
This illustrates that selecting evidence requires interrogating what the number actually measures, not just its headline value. A better statistic would show the net income change for households near the poverty line, adjusted for inflation and hours worked.
Contrasting Case: When Correlation Masquerades as Causation
A superficially similar approach fails when students confuse correlation with causation. Imagine an essay on green technology adoption reducing wealth inequality. The student cites data showing countries with higher solar panel installation rates have lower Gini coefficients. This seems compelling, but it ignores confounding factors like overall national wealth or education levels. Controlling for GDP per capita is not by itself causal identification; GDP may be a confounder, but without a directed acyclic graph (DAG) showing the full causal structure, we cannot distinguish confounders from mediators or colliders. Avoid treating any single controlled variable as sufficient for causal claims.
Wealthier nations can afford both solar panels and progressive taxation. Without controlling for per-capita GDP and other structural factors, the statistic does not test the argument that green tech causes equality. It merely shows they co-occur. In the LSESU context, this error costs marks in “Critical Analysis” (15 marks) because the student failed to engage with alternative explanations. Always ask: could a third variable explain this pattern? For a deeper treatment of this problem, see our article on LSESU Essay Causal Inference: Why Correlation Is Only the Start of an Argument.
Diagnostic Application: Evaluating Source Credibility
To practice this skill, consider three potential sources for a statistic on remote work productivity. Source A: A blog post from a software company selling monitoring tools. Source B: A peer-reviewed journal article analyzing firm-level data. Source C: A government survey of self-reported output. Which should you choose? Source A has a conflict of interest; its data may exaggerate productivity gains to sell services. Source C relies on self-reporting, which can be biased by social desirability. Source B is methodologically transparent and independent. For the LSESU essay, prioritize Source B. If unavailable, use Source C but explicitly note its limitations. This diagnostic helps you align with the “Citations and Sources” criterion (10 marks), which rewards high-quality academic or institutional sources.
For a systematic method to assess sources quickly, see How to Read an Economics Paper in 30 Minutes: A Source-Triage Method for the LSESU Essay (2026).

Interpreting Diagnostic Results for Next Steps
If you consistently find yourself choosing biased sources, your next learning task is to master source triage. Read articles on how to assess research methodology, focusing on sample size, control groups, and funding disclosures. Useful feedback would involve a tutor asking, “What would disprove this statistic?” rather than “Is this statistic correct?” This shifts focus from verification to falsification, a core scientific habit. For students coming from IB or A-Level backgrounds, remember that exam templates often reward descriptive statistics. The LSESU rubric rewards analytical depth. You must move beyond describing the number to explaining why it matters for your specific argument.
Practical Strategy for Evidence Selection
Before writing, list your main claims. For each, identify one statistic that could support it and one that could contradict it. This forces you to think critically about the data’s directionality. For example, if claiming AI increases job displacement, look for data on new job creation in AI sectors too. This balanced approach strengthens your “Argument and Originality” score (25 marks). However, balanced does not mean mechanical one-pro-and-one-con. You must weigh the strength of evidence on each side, not merely present opposing views as equal.
Acknowledge limitations and explain why your chosen statistic remains robust despite them. This demonstrates the critical engagement valued in the competition. For common reasoning errors to avoid, see The Rigour Audit: Six Economic Reasoning Errors That Quietly Cost Marks in the LSESU Essay (2026).
Conclusion: From Data to Argument
Selecting evidence for the LSESU essay is about testing your logic, not decorating it. By rigorously evaluating whether a statistic truly supports your causal claim, you avoid common pitfalls like correlation-causation confusion. Use the diagnostic exercises above to refine your source selection skills. Remember, the goal is to build an argument that stands up to scrutiny, using data as a tool for clarity and precision. This approach aligns with the competition’s emphasis on independent research and critical analysis, helping you produce a standout submission.
Diagnostic: The “Headline Trap” in Minimum Wage Evidence
Building on the teaching illustration above, consider a common student error when interpreting hypothetical data. A draft essay claims that a 10% minimum wage increase reduces poverty because employment only fell by 1%. The student presents this as proof of net benefit. This is a classic “Headline Trap”: focusing on the aggregate direction of one variable while ignoring the distributional mechanics that determine actual welfare.
The Diagnostic Question: Does a 1% drop in employment combined with a 10% rise in hourly wages guarantee that household income for low-wage workers increased? No.
Why It Fails: The statistic measures individual labor market outcomes, not household economic security. Three specific mechanisms break the link between the headline numbers and the poverty claim:
- Composition Bias: If the 1% job loss falls disproportionately on secondary earners in non-poor households (e.g., teenagers), while primary earners in poor households retain jobs but face reduced hours, the aggregate employment figure masks who actually lost income.
- Hours vs. Rate: Employers may respond to higher hourly costs by cutting scheduled hours. A worker earning $15/hour for 40 hours ($600/week) might see their rate rise to $16.50 (+10%) but hours cut to 30 (-25%). Their weekly income drops to $495. The “10% wage increase” is nominal; the real income change is negative.
- Price Pass-Through: If local businesses raise prices to cover labor costs, the purchasing power of the higher wage diminishes. Without controlling for local inflation, the nominal gain may be zero or negative in real terms.
Concrete Next Practice Task: Before citing any single statistic in your LSESU essay, perform a “Mechanism Interrogation.” For each number, answer three questions in your notes:
- Who does this measure? (Individuals, firms, households?)
- What is missing from the denominator? (Hours worked, price levels, population groups?)
- Can I find a complementary metric? (If citing wage growth, can I also cite hours worked or household income surveys?)
If you cannot answer these, the statistic is decorative, not evidentiary. Replace it with a source that provides disaggregated data, such as a study linking wage changes directly to household disposable income rather than just employment rates. This shifts your argument from asserting a correlation to demonstrating a causal pathway, which is what the “Critical Analysis” criterion rewards.
Frequently Asked Questions
Can I use news articles as statistical sources?
News articles are generally weak sources for primary data. Use them only to find links to original reports or datasets. Cite the underlying institution or study instead, and assess whether the original methodology is checkable.
How many statistics should I include?
Quality over quantity. Two or three well-analyzed statistics that directly test your main arguments are better than ten loosely related numbers. Each statistic should connect to household income, prices, or other relevant variables as needed by your claim.
What if my data contradicts my thesis?
Adjust your thesis or explain the contradiction. Acknowledging conflicting evidence and addressing it strengthens your critical analysis score. Remember that balanced argumentation weighs strength, not mechanical equality of pros and cons.