Should Your LSESU Essay Include a Table or Chart? Data Exhibits Inside a 1,500-Word Limit (2026)
Usually the answer is no — and where the answer is yes, it is one exhibit, not three. The decisive fact is a rule most students skim past: the official page sets a maximum of 1,500 words excluding references. It does not say it excludes tables, figures or captions. Assume your exhibit costs words until the organiser tells you otherwise, and make it earn them.
The rule that decides this, read literally
Every year students tell us some version of “tables don’t count towards the limit, so I put my data in a table.” That belief usually comes from a different competition’s brief, or from a school coursework rule, and it is imported into the LSESU essay without checking.
What the official guidance actually says is narrower. The stated maximum is 1,500 words, and the stated exclusion is references. That is one exclusion, named explicitly. It does not extend by implication to table cells, axis labels, figure captions or footnotes. Two consequences follow immediately:
- Budget as if your exhibit counts. If it turns out not to, you have simply written a slightly shorter essay, which is rarely a problem. If you assume it does not count and you are wrong, you have submitted an over-length entry that you cannot revise after submitting.
- Never treat an exhibit as a loophole. Pushing three paragraphs of argument into a table with long sentences inside the cells is transparently an attempt to get round a limit, and it reads that way. The limit exists to test selection; evading it forfeits the point of the exercise.
If you want a definitive answer on whether cells and captions count, ask the organiser through the official channels before 1 September rather than after — and in the meantime, write to the conservative reading. Our 2026 prompts and rubric guide sets out the published criteria your evidence is being read against.
Four gates an exhibit has to pass
An exhibit is not decoration and it is not proof of effort. It is a compression device: it earns its place only when showing the numbers is genuinely cheaper or clearer than saying them. Run your candidate table or chart through four gates in order, and stop at the first one it fails.
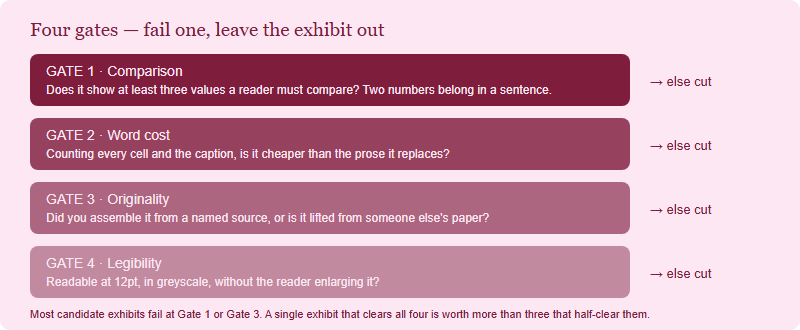
Gate 1, comparison. Exhibits exist for relationships: across countries, across time, across policy regimes. If your table has two numbers in it, write a sentence. If it has a single time series with an obvious direction, describe the direction. A table is justified when the reader would otherwise have to hold four or more values in their head at once.
Gate 2, word cost. Count everything: headers, cells, units, the caption, the source line. Then count the prose it would replace. If the exhibit is not meaningfully cheaper, it is a formatting choice rather than a compression device, and formatting choices do not earn 60 words in a 1,500-word essay.
Gate 3, originality. A chart pasted from a published paper tells the marker that someone else did the analysis. A small table you assembled — three countries, two years, one indicator, pulled from a named public dataset and normalised to a common base — is a piece of work that is visibly yours. That is the version worth including, and it is also the version that shows the kind of independent handling of evidence the criteria reward.
Gate 4, legibility. Your entry is formatted in 12pt Times New Roman with 1.5 line spacing and page numbers; confirm the required file format on the official page. A five-column table shrunk to fit that layout becomes unreadable; a colour-coded chart read in greyscale loses its distinctions. If it cannot be read comfortably in the required format, it is not evidence — it is a picture of evidence.

The word economics, worked through
Here is the calculation Gate 2 asks for, with real numbers. Suppose your argument needs six values: an indicator for three economies in two years.
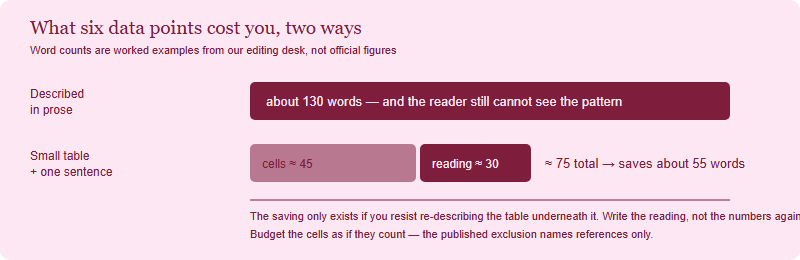
The saving in that example is real but modest, and it evaporates the moment you commit the most common error: presenting the table and then walking the reader through every cell in the paragraph below. That is paying twice. The paragraph under an exhibit should contain the reading — what the pattern implies for your argument, which comparison is doing the work, and what the exhibit does not settle. Never the numbers again.
Note also that the exclusion of references from the count cuts the other way in your favour: because your source list sits outside the 1,500 words, there is no reason to under-cite the dataset behind your exhibit in order to save space.
Building an exhibit that is yours
The difference between a borrowed chart and an original one is mostly a matter of four decisions you make and record.
| Decision | What weak exhibits do | What a defensible exhibit does |
|---|---|---|
| Source | Cites a news article that itself cites a database | Goes to the underlying public dataset and names the series and the access date |
| Comparability | Mixes nominal and real figures, or different base years, in one column | States the base year and whether figures are nominal or real, in the header or caption |
| Units | Leaves “GDP” unlabelled, or mixes percentages with levels | Puts units in the column header: percentage points, index (2015 = 100), USD billions |
| Selection | Includes every country and year the download contained | Includes only the cases the argument needs, and says in the caption why those cases |
The last row is the one that separates a good exhibit from a data dump, and it is also where a marker can see you thinking. “Three economies selected because each imported more than half its energy in the period, isolating the import-dependence channel” is a caption doing analytical work. “GDP growth in selected countries” is a caption doing nothing.
Two practical constraints for entrants writing from China. First, some international databases are slow or intermittently unreachable; download what you need early and keep the raw file, because rebuilding an exhibit on 31 August because a source will not load is an avoidable disaster. Second, if you use a domestic statistical source, give the English name of the publishing body alongside the series so an overseas marker can locate it — an uncheckable source is a weak source regardless of its quality.
Captioning, sourcing and the format rules
A caption has three jobs, in this order: say what the exhibit shows, say where the data came from, and say what was done to it. A workable pattern:
- Line 1 — label and content. “Table 1. Energy import dependence and headline inflation, three economies, 2021 and 2023.”
- Line 2 — source. Name the publishing organisation and series, with the in-text citation in the recommended Harvard style, and the full entry in your reference list.
- Line 3, only if needed — treatment. “Figures rebased to 2015 = 100; author's calculations.” The phrase “author's calculations” is not a boast, it is a disclosure, and it belongs there whenever you have transformed the raw numbers.
Then the mechanics. The entry is formatted in 12pt Times New Roman with 1.5 line spacing and page numbers, and named FORENAME SURNAME (uppercase) + Question X; confirm the required file format on the official page before you export. Check three things before you export: that the exhibit has not moved across a page break and split its caption from its body; that the fonts inside a chart image are still legible at print size; and that nothing renders as a broken object in the exported file, which happens more often than students expect when a spreadsheet chart is pasted rather than exported as an image. Remember that there is no revision after submitting — the file you upload is the file that gets read.
When the answer is simply no
Leave the exhibit out when any of the following is true, and do not feel you have lost anything:
- Your argument is theoretical. A question about whether economics is a distinct discipline, or about the fairness of a general claim, may need no numbers at all. Inserting a chart to look empirical is a tell, not a strength.
- The exhibit is there to prove you did research. The reference list already does that job, and it costs no words.
- You are over the limit and hoping the table is free. Solve the length problem in the prose. Compressing an argument is a demonstrable skill; hiding words in cells is not.
- You cannot explain every number in it. If a marker could ask “why is this column here?” and you would hesitate, the exhibit is a liability.
A final proportion note. In our editing desk’s judgement, a well-argued 1,500-word essay with no exhibit at all reads more strongly than an average essay with two. Exhibits are a multiplier on a good argument, never a substitute for one — if the argument is not settled yet, spend the evening on the argument and come back to this question afterwards. Our structure and method guide covers that stage, and the competition overview covers the rules your final PDF has to satisfy.
Do tables and charts count toward the 1,500 words?
The published exclusion names references only. Budget as if cells and captions count, and confirm with the organiser before submitting.
How many exhibits should a 1,500-word essay have?
Zero or one for almost every entry. Two is rare and needs a genuinely comparative argument to justify it.
Can I paste a chart from a published paper?
It is far weaker than building your own from the underlying dataset, and anything you reproduce must be properly attributed in your references.
Where should the source line go?
In the caption directly under the exhibit, with the in-text citation in Harvard style and the full entry in your reference list, which sits outside the word count.
Published by the editorial desk of this site, operated independently by Hanlin International Education (翰林国际教育) for China-based international-school students. This site is not the official competition website and is not affiliated with the LSESU Economics Society or the London School of Economics. Official rules are set by the competition and change yearly, so always confirm current details on the official site lsesuesec.org. Confirmed errors are corrected within 7 working days.