LSESU Essay Costing: A Back-of-Envelope Method for Sizing a Policy
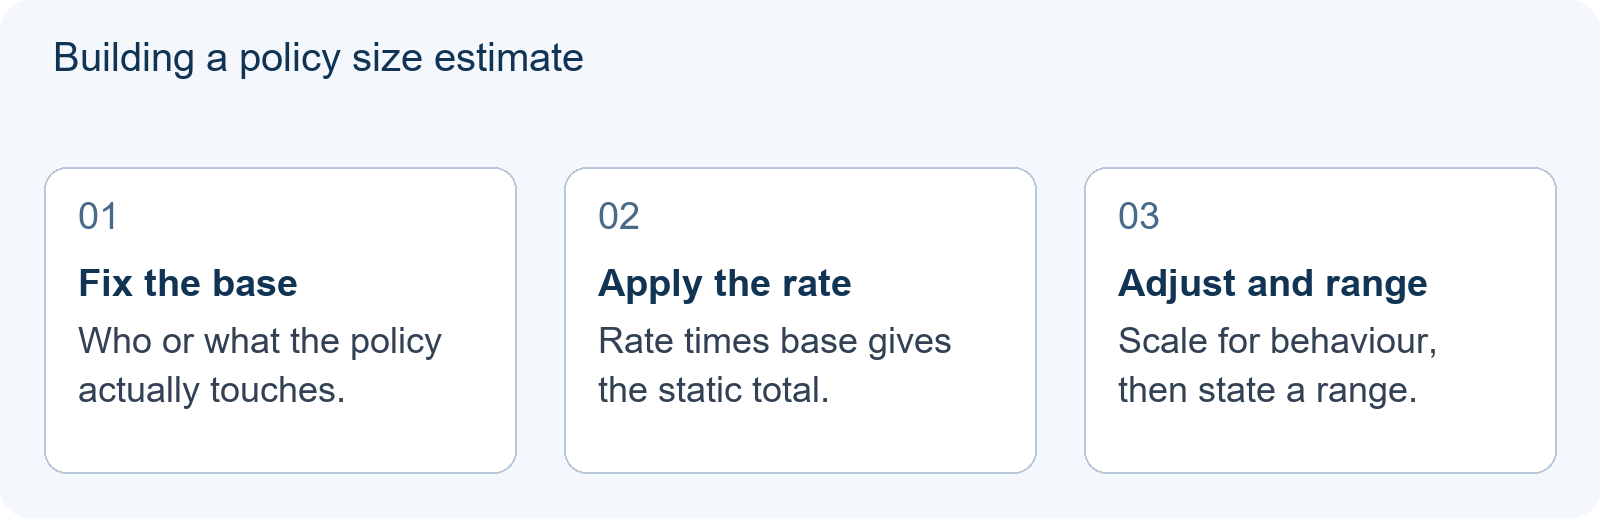
To attach an order of magnitude to a policy in an LSESU essay, use three lines of arithmetic: identify the population the policy actually touches, multiply that base by the rate or per-unit amount, then scale the result for the behavioural response you expect. Report the answer as a range, with the assumptions sitting in the same sentence as the number, and never present a point estimate you could not defend if a reader asked where it came from. Done this way, sizing is a 60-to-100-word move inside the essay, not a modelling project. That is the LSESU essay costing method in one paragraph.
The official competition page sets a maximum of 1,500 words excluding references, so a full cost-benefit table is usually a poor use of the limit, and nothing in the published scoring criteria rewards precision for its own sake. The criteria reward a claim that is applied, evidenced and tested. A sized estimate is one of the cheapest ways to do all three at once.
Why a sized claim reads differently
Compare two sentences. The first: “this would be expensive and would fall on a small group”. The second: “in the hypothetical illustration below, a 2-point levy on income above 150,000 units raises roughly 640 million units a year, about 1.6% of total revenue, on the assumptions stated with it”. The first is an opinion carrying evaluative adjectives. The second is a claim a reader can attack, and a claim that can be attacked has clearly been thought about.
The official 2026 competition page lists the scoring criteria as 25 marks for Argument and Originality, 20 for Application of Economic Theories, 15 for Evidence and Examples, 15 for Critical Analysis, and the remaining 25 across Structure and Clarity (10), Citations and Sources (10) and Topic Relevance (5). A sized estimate touches three of those at once: it puts a framework to work (Application), it carries a figure with a basis (Evidence), and it hands the counterargument something concrete to push against (Critical Analysis).
What it does not do is substitute for the mechanism. A number without a causal story is decoration; the mechanism chain has to come first.
The chain, step by step
Every back-of-envelope estimate in this genre is the same six moves in the same order. Almost all the mistakes happen at step two and step five.
| Step | Question to answer | Typical failure |
|---|---|---|
| 1. Population | Who is legally or practically affected? | Using “the public” as a denominator |
| 2. Eligible base | Which units does the rate actually apply to? | Taxing all income instead of the slice above a threshold |
| 3. Rate | How much per unit, in what period? | Mixing a percentage with a cash amount |
| 4. Static yield | Base multiplied by rate | Omitting the period the figure refers to |
| 5. Behavioural adjustment | How much of the static yield survives? | Inventing a response rate and then claiming precision |
| 6. Range and share | What spread is plausible, and how large is that against a budget? | Reporting a bare total with nothing to compare it to |
Step two is where drafts break most often, because it is easy to name the right population and then apply the rate to the wrong base. Step five is where the essay’s honesty is decided: the behavioural response is the least certain input in the chain, so it belongs in the range endpoints rather than buried in a hedge.
Worked illustration 1: a levy on the top 1%
The official competition page publishes the Topic 4 prompt as follows:
Topic 4 TAXATION & FAIRNESS
Is it possible and desirable to raise taxation on the top 1%?
The analysis below is editorial and uses hypothetical figures.
Teaching illustration — hypothetical figures invented for demonstration. These are not UK data and not an official estimate.
Take a hypothetical country, Country A: 40 million adults, a top 1% of 400,000 people, average taxable income in that group of 250,000 units, total government revenue of 40,000 million units, and a proposed levy of 2 percentage points on each person’s income above 150,000 units.
| Line | Calculation | Result |
|---|---|---|
| Group size | 1% × 40,000,000 | 400,000 people |
| Total income of group | 400,000 × 250,000 | 100,000 million units |
| Slice above threshold | 250,000 − 150,000 | 100,000 units per person |
| Levy per person | 2% × 100,000 | 2,000 units |
| Static yield | 2,000 × 400,000 | 800 million units |
| Static yield as share of group income | 800 ÷ 100,000 | 0.8% |
| After 20% behavioural erosion | 800 × 0.80 | 640 million units |
| Share of total revenue | 640 ÷ 40,000 | 1.6% |
| Range at 10% to 35% erosion | 800 × 0.90 and 800 × 0.65 | 720 and 520 million units |
Two readings come out of the same arithmetic. The levy takes 0.8% of the group’s income before behaviour, which is the number that speaks to the “possible” half of the question: it is small, so the argument cannot rest on revenue collapse alone. And it raises 1.6% of total revenue after behaviour, which is the number that speaks to “desirable”: it is not a rounding error, but neither is it a budget line that transforms the fiscal position.
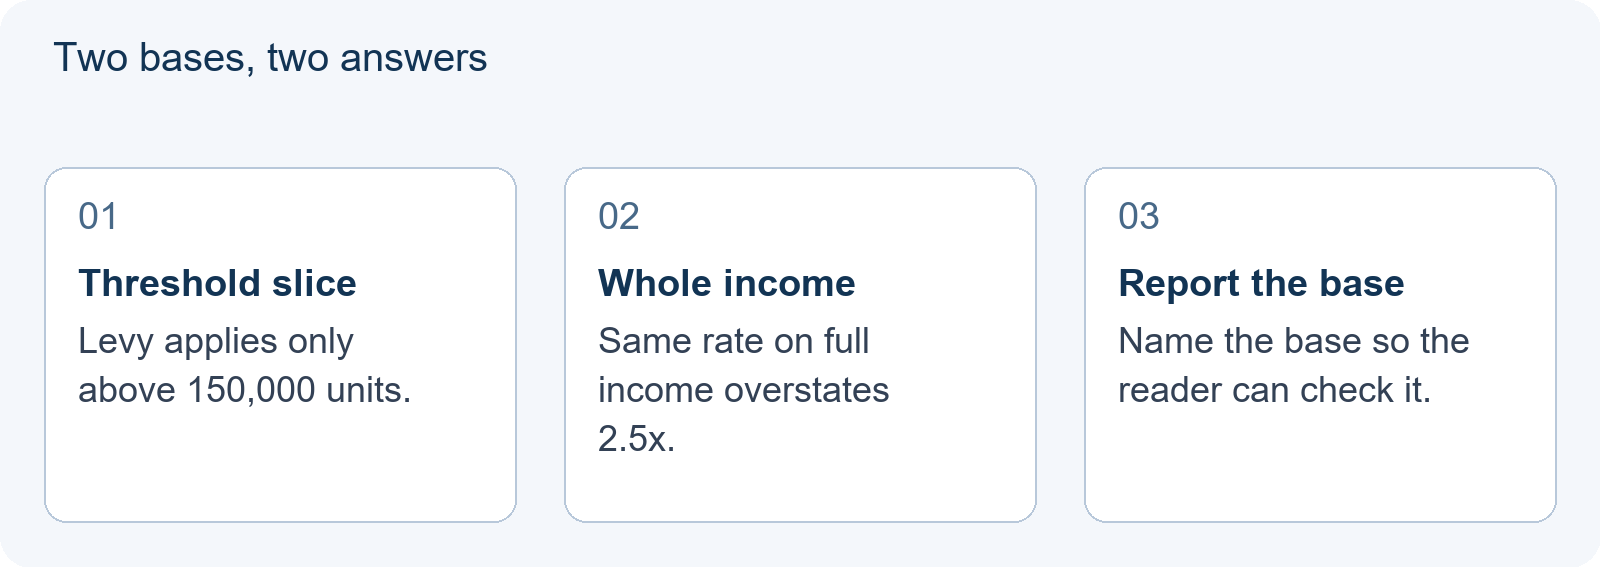
Now make the base error deliberately. Apply the 2% to the whole 100,000 million units of group income rather than to the 40,000 million above the threshold, and the answer becomes 2,000 million. That is two and a half times the correct static figure, and it would change the essay’s entire affordability claim. The rate was right; the base was wrong.
Worked illustration 2: a per-household transfer
The official competition page publishes the Topic 2 prompt as follows:
Topic 2 ENERGY & ECONOMICS
Following a sharp rise in UK energy prices, prepare a brief for a central bank on how monetary policy should respond. Take into account that the UK is a net importer of energy, and that the Bank of England has a mandate of keeping inflation steady at 2%.
Teaching illustration — hypothetical figures again, not an official estimate. Suppose a government in Country B, with 10 million households and 25 million adults, pays a flat 300-unit support payment per household against a 40,000 million unit revenue base. Suppose the payment is annual and runs for two winters.
The cost is 10,000,000 × 300 = 3,000 million units, or 7.5% of revenue. That is a substantial fiscal commitment and it should be shown as such.
Use the adult count instead and the same 300-unit rate yields 25,000,000 × 300 = 7,500 million units, or 18.75% of revenue. The rate has not changed; only the unit has. In both illustrations the wrong base inflates the answer by exactly 2.5 — an artefact of the numbers chosen here, not a general rule. The general point is that naming a population you did not actually use breaks the total; here it inflates it.
Because the payment runs for two winters, the total cost is 6,000 million units over the period, while the annual cost stays at 3,000 million. Both are correct. Only one is correct in the sentence you are writing, so the sentence has to say which.
If you are writing the energy brief, a household transfer is a fiscal measure that the central bank observes rather than operates; costing it is useful only if you explain why a central bank would discuss it. That is the kind of distinction the Application criterion asks you to make, and a bare number lets a reader miss it.

How to report it inside 1,500 words
Resist the table. A multi-row table costs cells, a caption, and prose pointing at it, and it makes the reader do the arithmetic. One sentence plus one assumption line is cheaper and more readable:
“A 2-point levy on income above 150,000 units raises about 640 million units a year — 1.6% of total revenue — assuming 400,000 affected taxpayers and 20% behavioural erosion (range 520–720 million).”
That is about 30 words. Add a two-line gloss — “the erosion assumption is the soft spot; at 10% the yield is 720 million, at 35% it is 520 million” — and the whole block sits under about 80 words, roughly 5% of the limit. Every element the reader needs is present: the rate, the base, the threshold, the period, the behavioural assumption, the range, and a comparison figure. The citation criterion is worth 10 marks, and Harvard referencing is recommended, so the base figure needs a visible source.
The behavioural assumption is where you are most exposed. If a reader disputes 20%, the essay should already say what happens at 10% and 35%, which is the difference between a range and a decoration. LSESU Essay Elasticity Check: Test Your Policy Conclusion shows how to run that sensitivity test properly once the first-order number exists.
Five errors that survive a proofread
| Error | How it shows up | Fix |
|---|---|---|
| Stock versus flow | A one-off cost written as if annual | Put the period in the sentence |
| Annual versus total | A multi-year programme costed per year only | State the horizon and both figures |
| Per household versus per adult | The base counts the wrong unit | Name the unit in the base line |
| Rate on the wrong base | A threshold levy applied to all income | Draw the threshold explicitly |
| Behaviour as decoration | Erosion mentioned, point estimate still reported | Convert it into range endpoints |
The first four are arithmetic slips that a reader can catch, which is why they are worth catching before submission. The fifth is a presentational choice and is entirely within your control: if you have mentioned that people will respond to the tax, you cannot then report a single number as though they will not.
When not to estimate at all
If no honest base exists, do not manufacture one. A policy that has never been implemented anywhere, applied to a population whose size you cannot source, does not become more rigorous when you invent a denominator — it becomes less, because the invented figure is the first thing a sceptical reader will probe.
The alternative is a structural claim without a total: the cost falls entirely on group X, it is proportional to Y, and it is therefore bounded above by Z. That is a weaker claim than a sized estimate and a much stronger one than a fabricated number. Where a published estimate exists, use it and state its scope — the population it covers, the year it refers to, and what it does not include. LSESU Essay Evidence Selection: Use a Statistic to Test an Argument sets out how to attach an external figure to a claim without over-reading it.
A five-line check before you submit
- Does every figure in the estimate carry a stated base and a stated period?
- Is the base the one the policy applies to, or the population it is merely discussed in relation to?
- Is the behavioural adjustment visible in the range endpoints rather than buried in a hedge?
- Could a reader reproduce your arithmetic from what is printed on the page?
- Does the number change your conclusion, and have you said how?
That last line matters most. If your recommendation flips between 520 and 720 million, the essay needs to say why; a range that changes the verdict is a finding, not a footnote. A sized claim is a service to the reader: it says what you think the world looks like and where you could be wrong. Before you submit, run the ordinary figure-by-figure audit described in The Numbers Audit: Verifying Every Figure and Citation Before You Submit (2026) over whatever you have built, because a correct chain still fails if one input is misquoted.
If you have a question about the arithmetic or the assumptions underneath it, the site’s existing footer contact is the route to ask.
General event background is available at Event background.
Frequently Asked Questions
How precise should a policy cost estimate be in a 1,500-word LSESU essay?
Order of magnitude only. One or two significant figures, a stated base, a stated period and a range built from the least certain input give you everything a reader needs. Presenting a figure to several decimal places is unlikely to help; it invites a challenge you cannot answer in the space available.
What should I do if I cannot find a reliable figure for the affected population?
Do not invent a denominator. Either use a published estimate and state its scope — which population it covers, which year, what it excludes — or drop the total and make a structural claim instead, such as the cost falling entirely on one group and being proportional to one variable. An unsourced denominator is the first thing a sceptical reader will test.
Will showing arithmetic eat too much of my word count?
No. The reporting pattern in this article is roughly 30 words, and even with a two-line gloss on the behavioural assumption the whole block stays under about 80 words — around 5% of the 1,500-word maximum. A table of the same numbers costs more, because it needs a caption and prose to point at it.